| Model | Year | Region | Color | Fuel_Type | Transmission | Engine_Size_L | Mileage_KM | Price_USD | Sales_Volume | Sales_Classification | |
|---|---|---|---|---|---|---|---|---|---|---|---|
| 0 | 5 Series | 2016 | Asia | Red | Petrol | Manual | 3.5 | 151748 | 98740 | 8300 | High |
| 1 | i8 | 2013 | North America | Red | Hybrid | Automatic | 1.6 | 121671 | 79219 | 3428 | Low |
| 2 | 5 Series | 2022 | North America | Blue | Petrol | Automatic | 4.5 | 10991 | 113265 | 6994 | Low |
| 3 | X3 | 2024 | Middle East | Blue | Petrol | Automatic | 1.7 | 27255 | 60971 | 4047 | Low |
| 4 | 7 Series | 2020 | South America | Black | Diesel | Manual | 2.1 | 122131 | 49898 | 3080 | Low |
| 5 | 5 Series | 2017 | Middle East | Silver | Diesel | Manual | 1.9 | 171362 | 42926 | 1232 | Low |
| 6 | i8 | 2022 | Europe | White | Diesel | Manual | 1.8 | 196741 | 55064 | 7949 | High |
| 7 | M5 | 2014 | Asia | Black | Diesel | Automatic | 1.6 | 121156 | 102778 | 632 | Low |
| 8 | X3 | 2016 | South America | White | Diesel | Automatic | 1.7 | 48073 | 116482 | 8944 | High |
| 9 | i8 | 2019 | Europe | White | Electric | Manual | 3.0 | 35700 | 96257 | 4411 | Low |
BMW Car Sales Analysis & Price Prediction
Temporal Validation of Market Value
EDA: Market Trends & Segmentation
Regional Performance and Price Trends
| Sales Trend Over Time | Top Models by Regional Sales Volume |
|---|---|
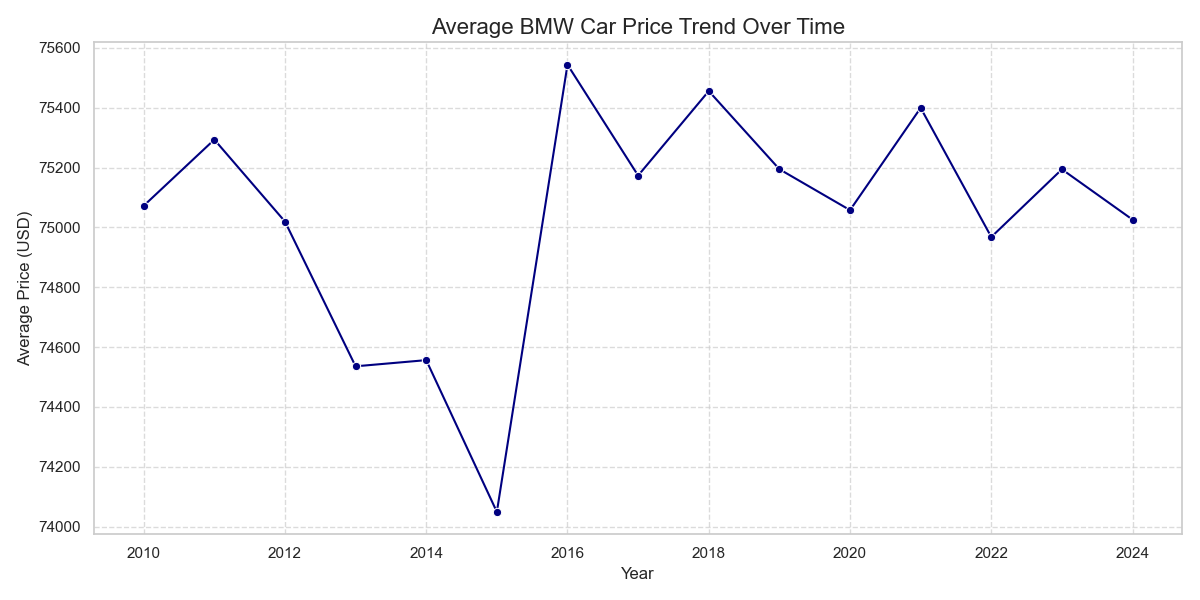 |
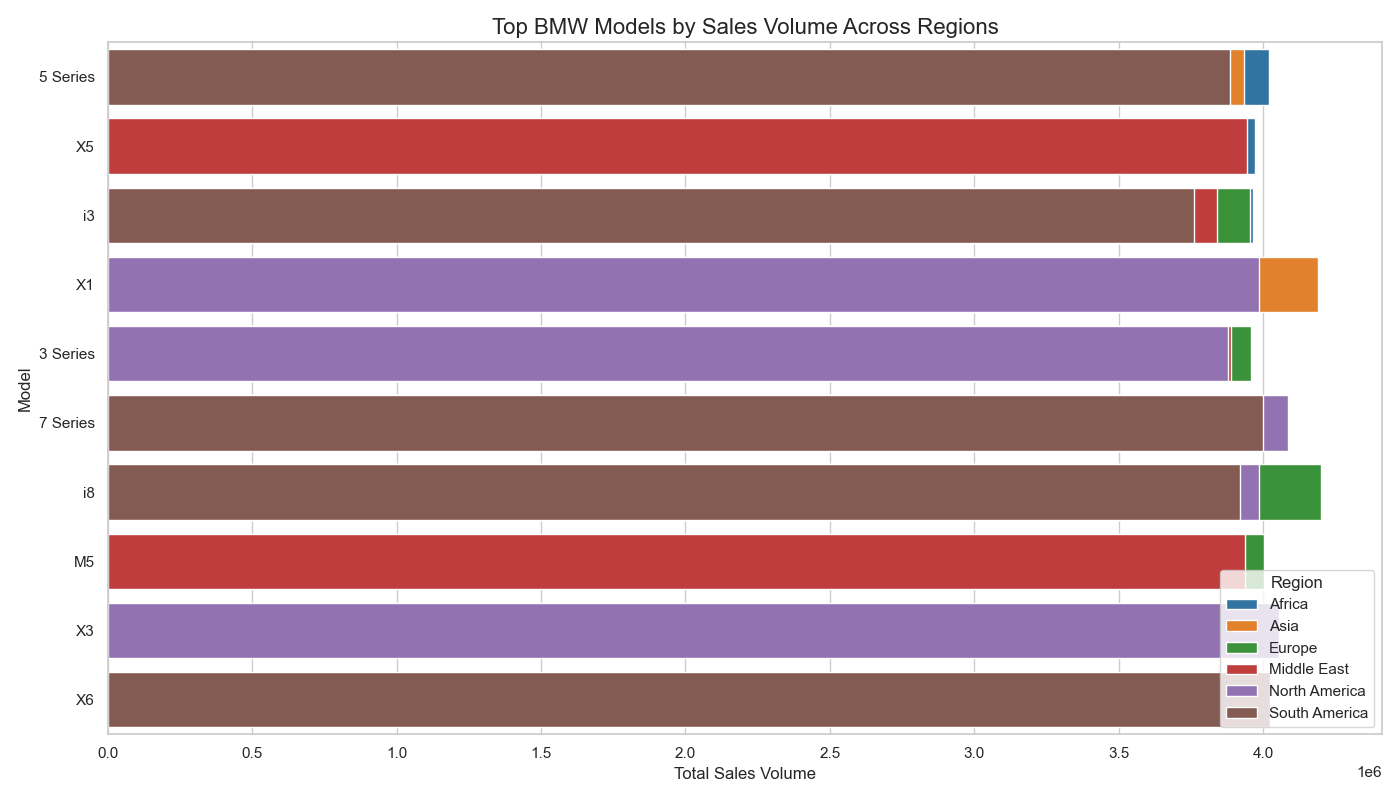 |
| Observation: The average price shows a clear, non-linear upward trend over time, suggesting market inflation. This justifies the Temporal Validation strategy. | Observation: Model popularity is highly segmented by region. This confirms that the Region variable is a critical feature for effective price segmentation. |
Detail: The analysis utilized over 50,000 records of multi-regional sales. Regional features were processed using One-Hot Encoding to prevent models from assigning arbitrary ordinal relationships to categories.
Global Market Demand
Global Market Demand: Top 10 Models (2010–2024)
| Volume by Model (2010–2024) |
|---|
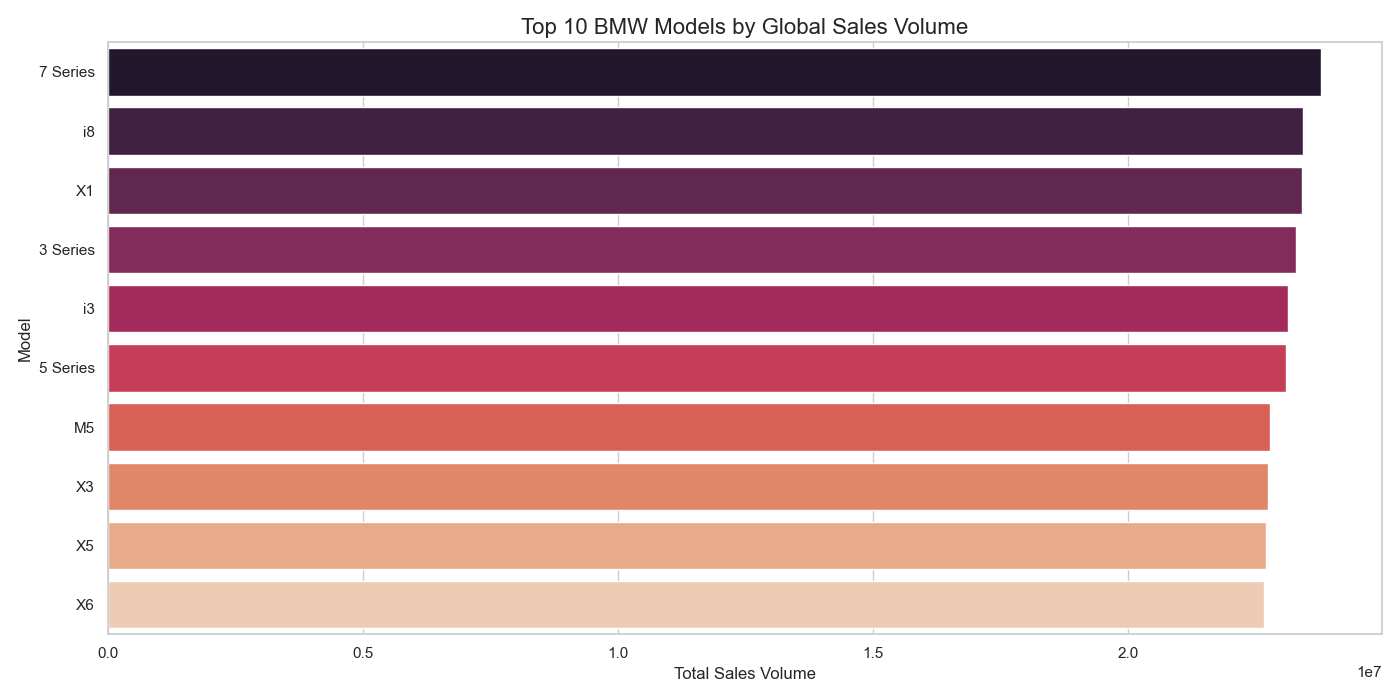 |
| Insight:Globally, sales volume is often dominated by core sedan and SUV series (e.g., 3-Series, 5-Series, X3, X5), reflecting high overall market liquidity. |
Impact:Models with high global volume typically exhibit more stable pricing due to consistent demand, which reduces prediction volatility. EDA Detail:This volume data was analyzed before the temporal split to understand the underlying market foundation across all years. |
EDA: Correlation Analysis
Price Relationships
| Correlation Matrix | Price Distribution by Fuel Type |
|---|---|
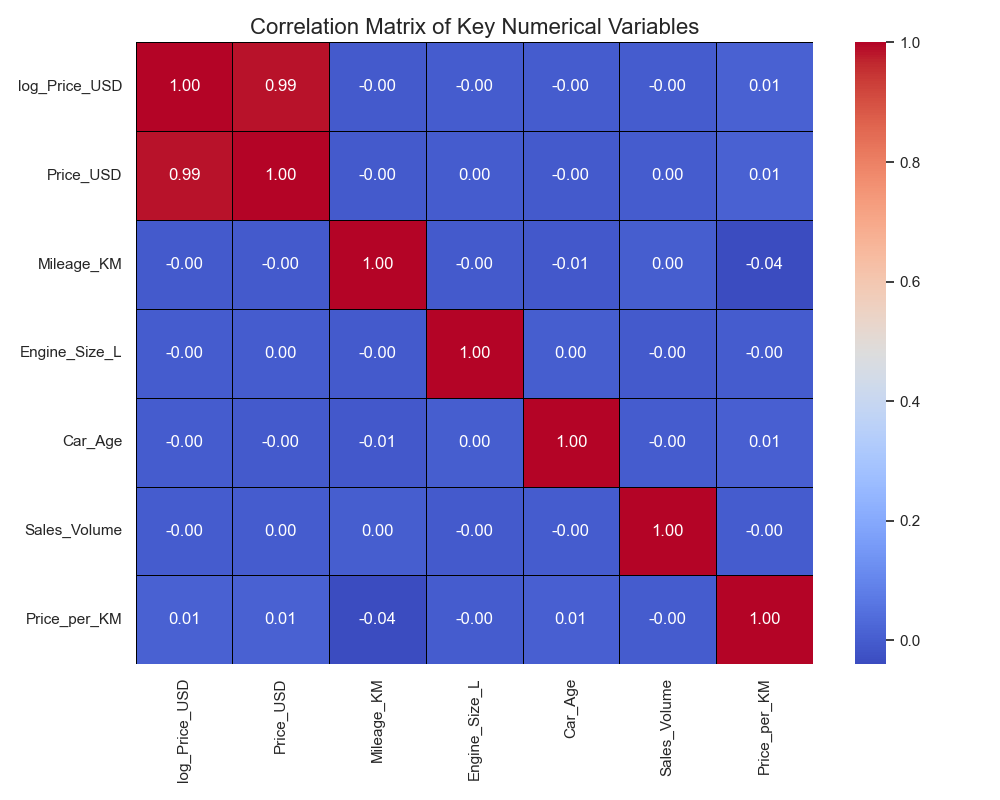 |
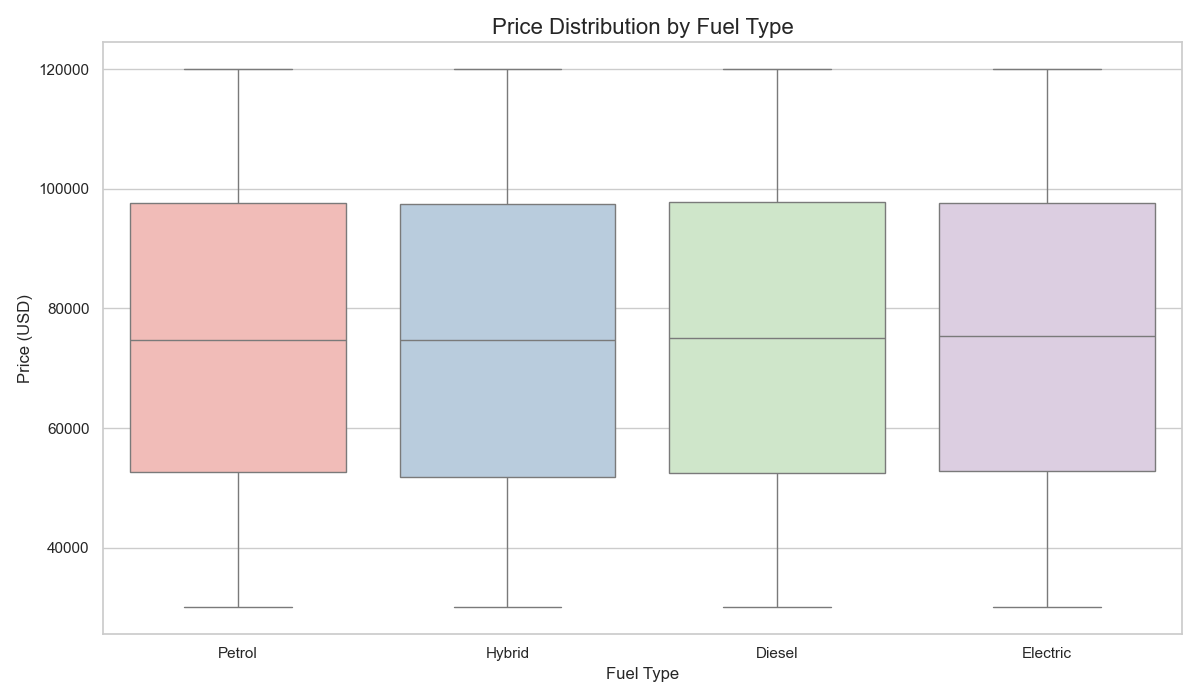 |
| Observation: Log-Price shows a strong inverse linear relationship with Car Age (depreciation) and a strong positive correlation with Engine Size (performance/class). | Observation: Significant differences in the median price across fuel types confirm this categorical feature has strong predictive power and is not independent of the target. |
Detail: Two key features were engineered for this analysis: Car Age (calculated as Current_Year - Model_Year) and Price per KM (calculated as Price_USD / Mileage_KM), both showing significant predictive value.
| Full Feature Importance |
|---|
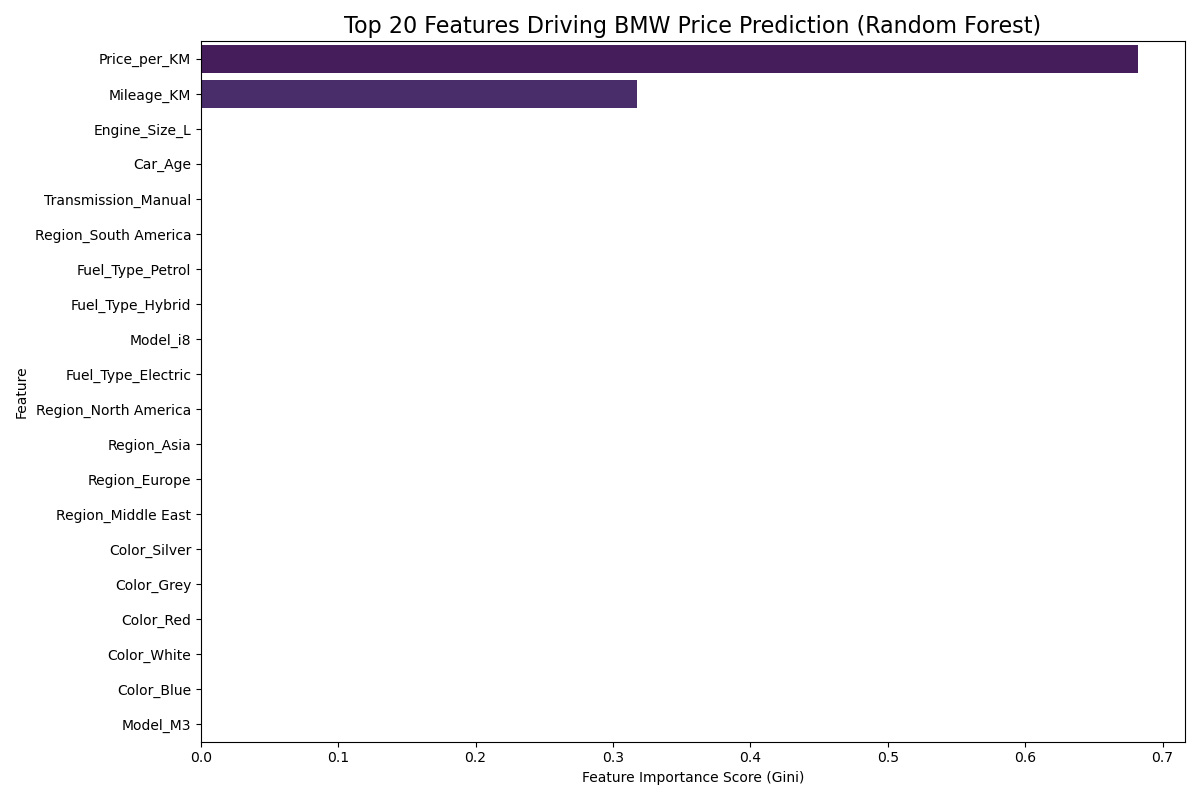 |
Technical Detail: The model was chosen for its ability to calculate Feature Importance via Mean Decrease in Impurity (Gini). The trained model was serialized and saved as rf_best_model.joblib for future deployment.